
CivicSync Map Guide
Welcome to the CivicSync documentation. The Crime Map is the core interactive visualization tool of the platform. It allows residents and local authorities to visualize public safety data, track trends, and investigate specific incidents in real-time.
1. Layout & Structure
The Map Canvas
Powered by Leaflet and OpenStreetMap, the canvas provides the geographical context. It is fully interactive, supporting panning, zooming, and clicking on specific data points.
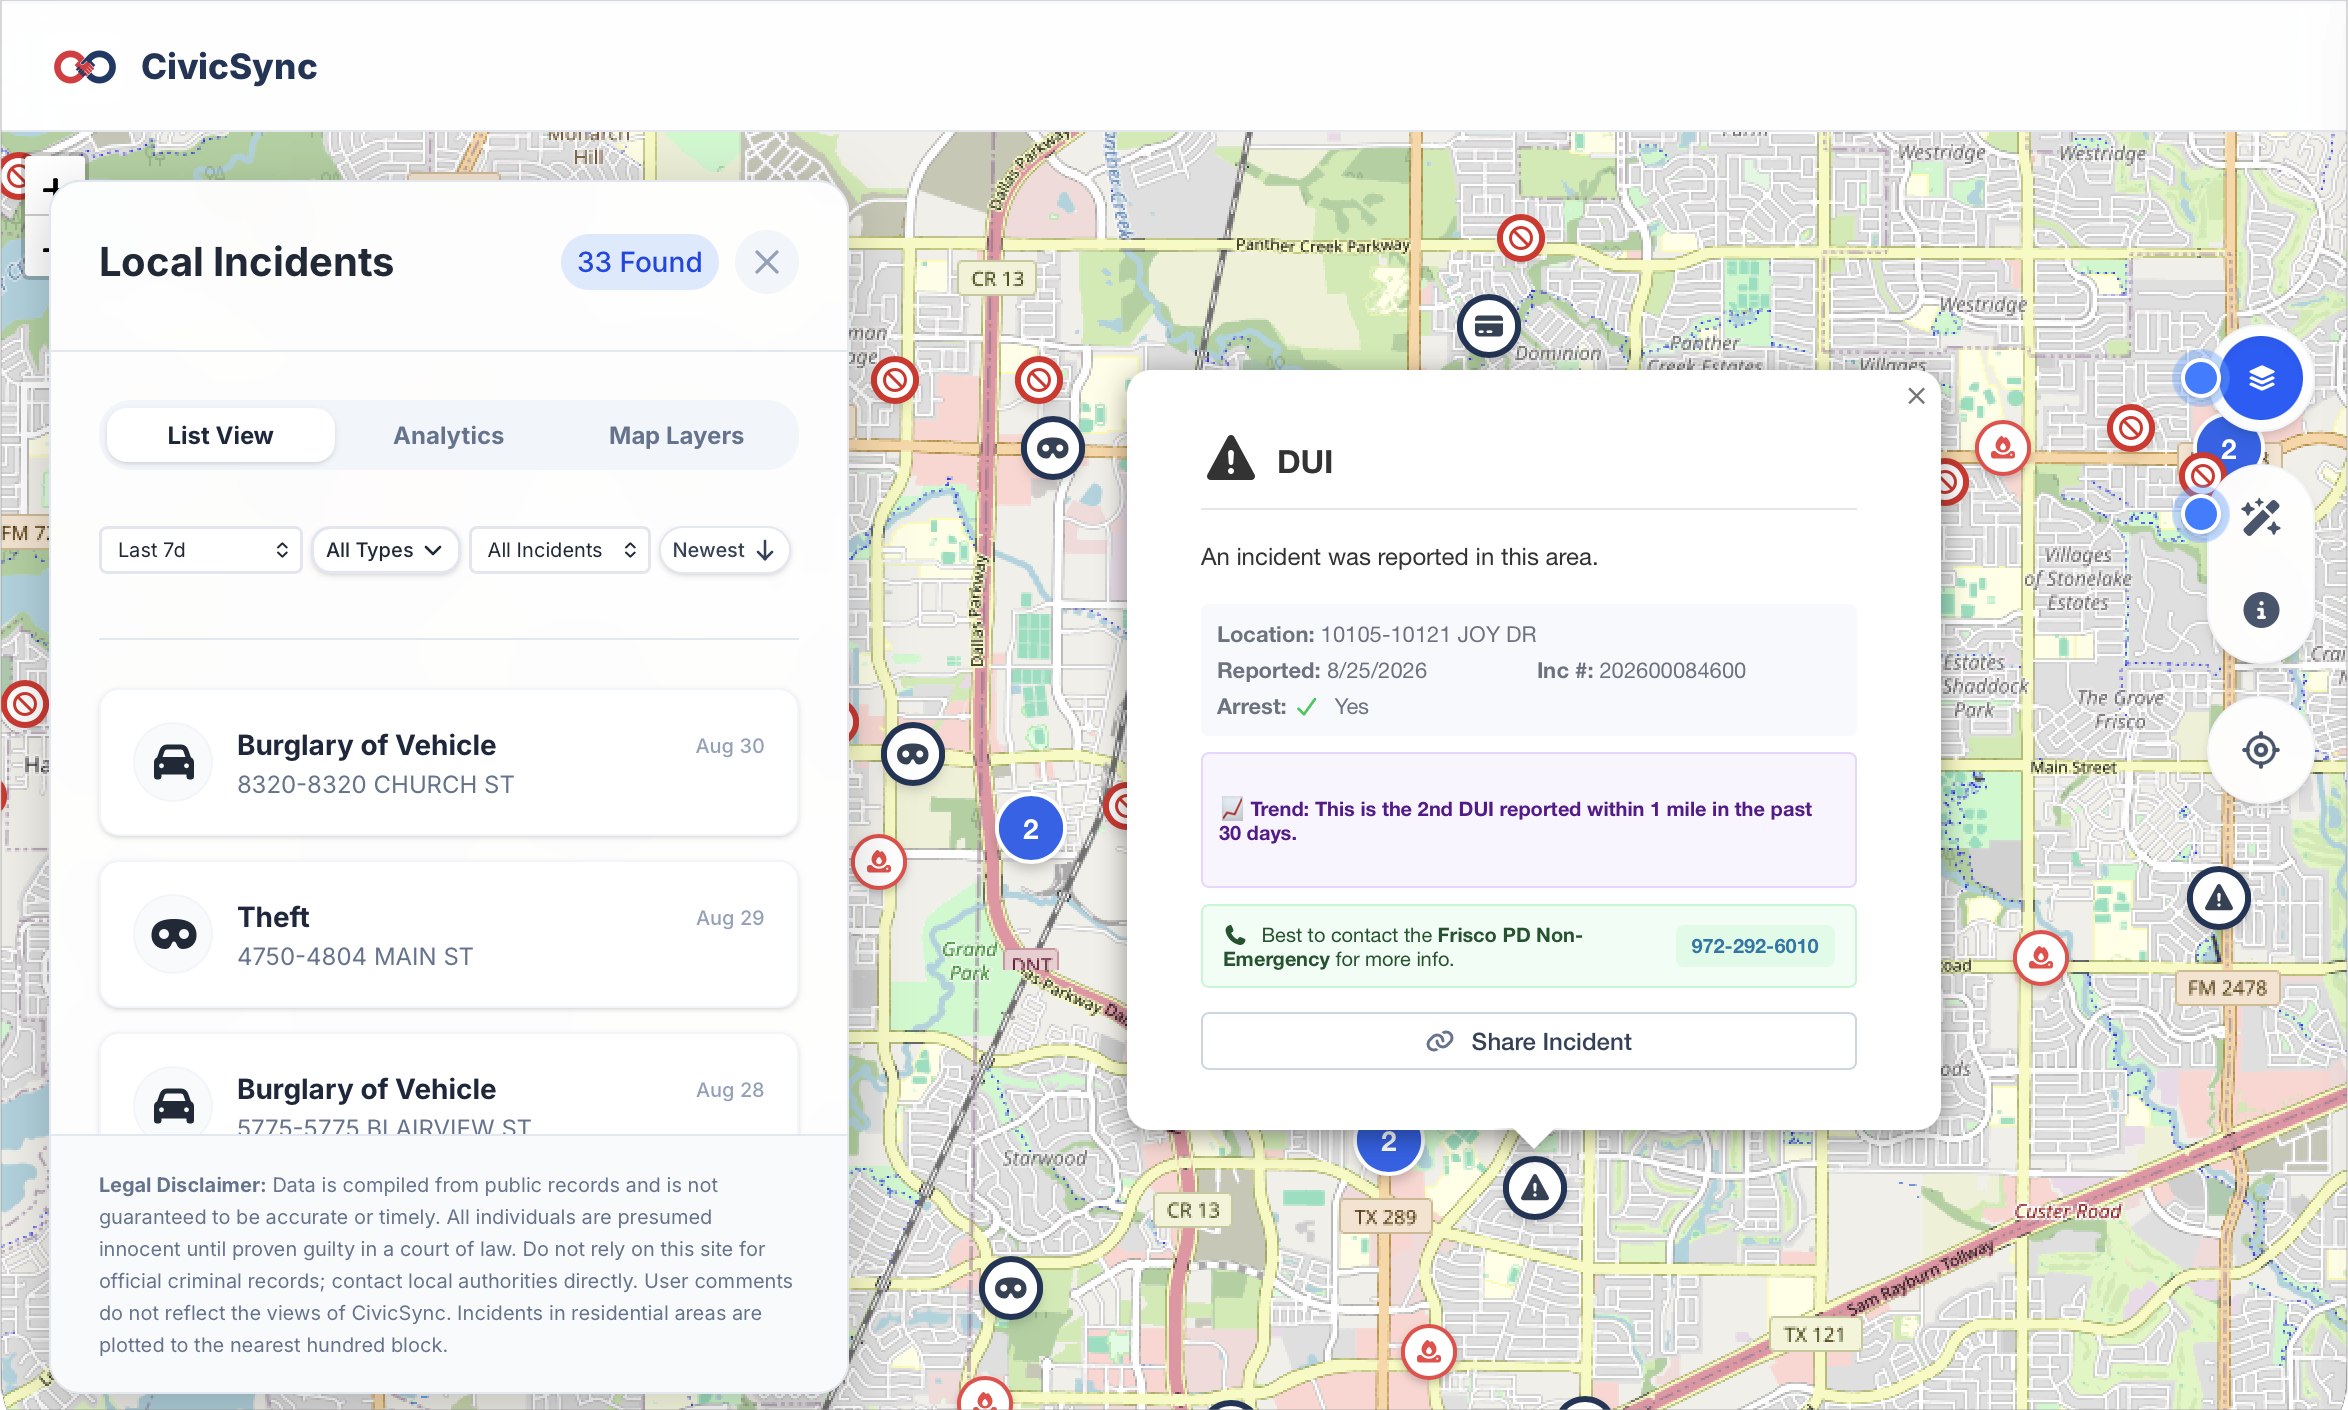
The Sidebar (Filters & Context)
Located on the left side of the screen, the sidebar allows you to control what data is displayed.
- Date Range Picker: Filter incidents by a specific timeframe.
- Incident Type Toggles: Show or hide specific categories of crime.
- Heatmap Toggle: Switch between viewing individual incident pins and a density heatmap.
AI Overlay Summaries
A floating panel that provides a natural language summary of the current viewport, highlighting trends, anomalies, and safety advice specific to the selected neighborhood.
2. Core Features
Dynamic Heatmaps
When analyzing trends, individual pins can become clustered. The heatmap feature aggregates data points into glowing intensity zones, allowing you to instantly identify crime hotspots at a glance.
Verified Evidence & Suspect Linking
Incidents on the map aren't just anonymous reports; they are verified data points. Admins can link incidents to known suspects via a secure pipeline, helping the community track repeat offenders visually.
3. Incident Icon Library
CivicSync utilizes standard iconography to categorize incidents visually on the map. Here is the legend for all incident types:
| Icon | Category | Description |
|---|---|---|
| Traffic/Vehicle | Incidents involving vehicles (e.g., DUI, Burglary of Vehicle, accidents). | |
| Theft/Burglary | Property crimes including theft, burglary, and robbery. | |
| Violent/Assault | Crimes against persons including assault, battery, and robbery. | |
| Drugs | Narcotics and drug-related offenses. | |
| Weapons | Incidents involving firearms or other weapons. | |
| Sex Offenders | Registered sex offender locations. | |
| Other Incidents | General reports that do not fit into other categories. |